Ofgem’s £1,723 Price Cap Is Not a Maximum Bill
Ofgem’s £1,723 annual benchmark for October to December is based on typical dual-fuel Direct Debit use in Great Britain. The cap limits unit rates and standing charges on standard variable tariffs, not each household’s total bill.

Ofgem’s energy price cap for 1 October to 31 December 2026 is £1,723 a year for a typical dual-fuel household paying by Direct Debit in England, Scotland and Wales, according to Ofgem’s current rate table. Northern Ireland is outside this Ofgem cap. The typical-use benchmark rose 4%, or £60, but £1,723 is not a ceiling on every household’s bill. What a customer pays depends on energy use and the rates and standing charges for the home.
What the cap limits
Ofgem’s price-cap explanation says the cap limits the unit rate and daily standing charge suppliers can set on standard variable tariffs. It does not limit the total bill: using more electricity or gas means a higher charge. A fixed tariff is not covered by this cap.
The £1,723 amount is a comparison point based on typical use and average Direct Debit rates. Ofgem publishes separate figures by region and payment method, including standard credit and prepayment. Standing charges also vary by region. A home with a different meter, payment method or level of use can have a different total. The cap is reviewed every three months, so the headline amount describes one quarter rather than a year-long price guarantee.
The rates changed in different ways
Ofgem’s average Direct Debit table lists electricity at 26.32 pence per kilowatt-hour, with a daily standing charge of 54.83 pence. Gas is 7.97 pence per kilowatt-hour with a 29.68 pence daily charge. These are averages for the period; the table gives regional rates and payment-method details.
At these average rates, each extra 100 kWh of electricity adds £26.32 in unit charges, while 100 kWh of gas adds £7.97; the daily standing charges are separate. This is an illustration, not a bill quote. Regional rates can differ, and a home’s actual use determines its total, so check the row for the relevant postcode before applying these figures.
For the previous period, the averages were 26.11 pence per kWh and a 57.19 pence daily charge for electricity, plus 7.33 pence per kWh and a 29.04 pence daily charge for gas. The unit rate rose for both fuels while the electricity standing charge fell. These figures are rounded and do not estimate an individual bill without the home’s actual consumption.
The October rates also reflect a VAT change. Ofgem’s table shows domestic electricity without VAT from 1 October 2026 through 31 March 2027, while gas prices include 5% VAT. The regulator says costs cannot be compared directly with the previous cap period because of this change. The 4% headline describes the overall movement in the typical-use benchmark, not a simple increase in every charge on every bill.
How to check your own tariff
Start with the tariff name on a recent bill. If it is a standard variable tariff, use Ofgem’s regional table to find the unit rate and standing charge for the postcode and payment method. If the contract is fixed, the price cap does not set its rates. For a multi-rate meter such as Economy 7, compare the peak and off-peak prices rather than relying on one all-day figure.
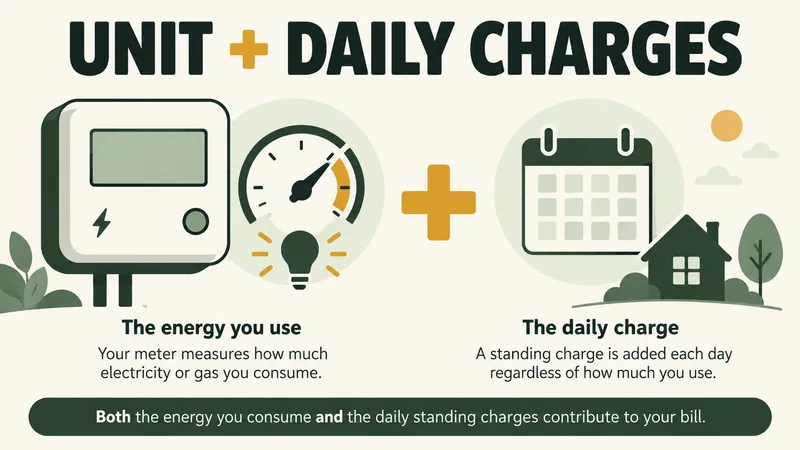
Separate the daily standing charge from the price for each kWh. The standing charge is due each day even when a home uses no energy. The unit charge follows consumption. A basic estimate multiplies the unit rate by the kWh used, then adds the standing charge for the billing period; repeat it for gas and electricity using the correct meter readings.
For multi-rate electricity, Ofgem sets separate peak and off-peak rates. The supplier’s prices must stay within the relevant cap, but the amount used at each rate changes the total. To understand a possible payment change, compare the tariff, region, payment method, standing charge and recent use with the rates in the current table. The £1,723 figure is useful for comparing the quarter with earlier benchmarks, not for predicting an individual household’s bill.
Sources & further reading
- Energy price cap unit rates and standing chargesOfgem · accessed Oct 12, 2026
- Energy price cap and standing charges explainedOfgem · accessed Oct 12, 2026
- Energy price cap will rise by 4% in October 2026Ofgem · accessed Oct 12, 2026