Fed Survey: Real Median Income Rose 7%; 19.6% of Families With Debt Paid Late
The Federal Reserve released the 2025 Survey of Consumer Finances on 9 October 2026, showing real median family income up 7 per cent to $82,200 while real mean income fell 6 per cent to $145,200, and real median net worth up 2 per cent to $215,900. Among families with debt, 19.6 per cent reported being late on a payment, up from 12.2 per cent in 2022, and the share whose debt payments exceed 40 per cent of income rose to 8.6 per cent.

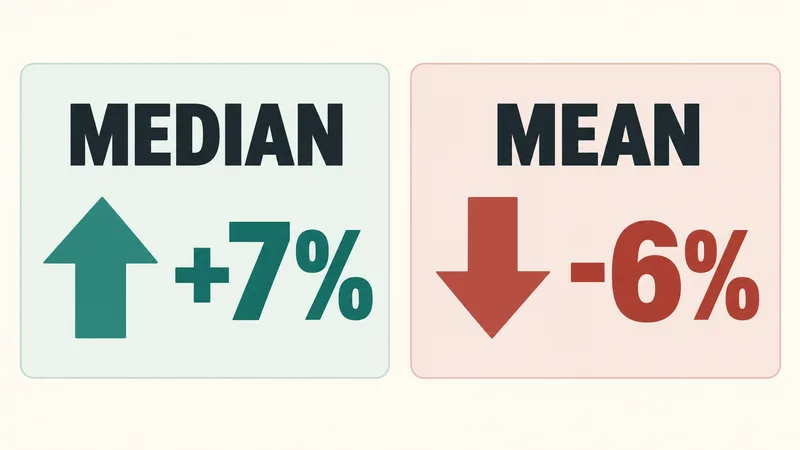
The Federal Reserve released its 2025 Survey of Consumer Finances on 9 October 2026, and its headline income measures moved in opposite directions. Real median family income rose 7 per cent between the 2022 and 2025 surveys, to $82,200, while real mean income fell 6 per cent to $145,200. Real median net worth rose 2 per cent to $215,900. Among families with debt, the share reporting a late loan payment in the previous year rose from 12.2 per cent to 19.6 per cent.
The survey has run every three years since 1989 and is conducted for the Federal Reserve Board by NORC at the University of Chicago. The 2025 round interviewed 4,367 families, down from 4,602 in 2022.
What the 2025 survey measured
Income in the survey covers the full calendar year before the survey year, so the 2025 figures describe 2024 income and the 2022 figures describe 2021 income. Every dollar amount in the report is adjusted to 2025 dollars using the consumer price index for all urban consumers. The Board picks participants at random from 119 geographic areas across the United States, and it published a summary report, Changes in U.S. Family Finances from 2022 to 2025, alongside the data.
Median income rose while the mean fell
The two income measures diverging means the income distribution narrowed between the surveys. Families at the top drove the fall in the mean: the report notes that the decline in mean income is more moderate once the top 1 per cent of families by income is excluded.
The change was uneven across the distribution. Median income among families in the 40th to 60th percentiles of usual income rose 7 per cent, to $83,100; among those in the 20th to 40th percentiles, it rose 3 per cent, to $50,500. Families in the top decile lost 6 per cent of median income, which fell to $387,200.
Two further measures describe how uncertain households were about their own finances. In the 2025 survey, 23 per cent of families said their income had been unusual, down from 28 per cent in 2022 and back to pre-pandemic levels. The share who said they did not have a good idea of what their income would be in the next year rose to a new survey high of 37 per cent.
Net worth: small gains, wide gaps
Net worth grew more slowly between 2022 and 2025 than in the two previous survey periods, and the gains were spread unevenly. Median net worth for families whose reference person was under 35 fell 23 per cent to $33,000, with mean net worth down 33 per cent to $135,400; the report attributes that mainly to the unwinding of business equity gains made between 2019 and 2022. Families aged 75 or older moved the other way, with median net worth up 37 per cent and the oldest group holding the highest median net worth of any age group.
Both ends of the distribution moved apart. Median net worth in the bottom quartile fell from $3,800 to $1,700, and mean net worth in that group was negative $4,300. Median net worth in the top decile rose 31 per cent to $3,669,900.
By race and ethnicity, median net worth for Black non-Hispanic families fell 25 per cent to $36,800. Median net worth for White non-Hispanic families reached $332,100, a ratio of about nine to one and the widest recorded since 2016. Hispanic or Latino families recorded an 18 per cent rise in median net worth to $79,600, the smallest gap to White non-Hispanic median wealth in the modern survey.
Housing divided families too. The homeownership rate was about 66 per cent, little changed from 2022, and the median net housing value for owners rose to $230,000 from $218,900. Homeowners gained 6 per cent in median net worth, to $458,900; renters and other non-homeowners lost 7 per cent, to $10,600.
Retirement accounts and stocks
Among families whose reference person was 64 or younger, 65.1 per cent took part in a retirement plan of some kind, slightly above 64.4 per cent in 2022. Retirement accounts were held by 54.9 per cent of families, and the median balance among holders rose 11 per cent to $106,000.
Direct ownership of stocks fell from 21 per cent of families to 19 per cent, while the conditional median holding rose from $16,400 to $30,000. Counting direct and indirect holdings together, the Board reports that stock market participation slipped from 58 per cent to 56 per cent, and that the median holding among families who owned stock grew 36 per cent, from $56,900 to $77,400.
Late payments rose sharply
About 77 per cent of families had some form of debt, and median and mean debt outstanding were unchanged from 2022. What changed was how well families kept up with it. Among families with debt, 19.6 per cent reported being late on a payment during the previous year, up from 12.2 per cent, and 8.2 per cent reported being 60 days late or more, up from 4.9 per cent.
The share of families whose debt payments exceeded 40 per cent of income rose from 6.5 per cent to 8.6 per cent, the largest share since 2010 according to the Board's report. Ratios that aggregate across all families tell a similar story: debt to income rose from 89.4 to 94.9 and payments to income rose from 9.9 to 11.9, even as the leverage ratio comparing debt with assets fell from 10.7 to 10.0, because asset values grew faster than incomes. Payday borrowing rose slightly, to 2.6 per cent of families. Bankruptcy in the past five years held at 1.4 per cent of families, and foreclosure at 0.7 per cent.
What the survey can and cannot support
The report sets out the limits of its own measures. Medians are not additive, so adding the median of one item to the median of another does not give the median of the total, and subtracting median liabilities from median assets will not produce median net worth. The survey's payment-to-income measure is not the debt service ratio published elsewhere: it covers debts families reported rather than debts reported to a credit bureau, it uses before-tax survey income rather than disposable income from the national accounts, and it asks respondents directly about the payments they make.
The 2022 survey also fell in an unusual period, which the report flags when it compares 2019 with 2022. That matters for reading the three-year changes here as a picture of a longer trend rather than of one year.
Sources & further reading
- Federal Reserve Board releases results of the 2025 Survey of Consumer FinancesBoard of Governors of the Federal Reserve System · accessed Oct 12, 2026
- Changes in U.S. Family Finances from 2022 to 2025: Evidence from the Survey of Consumer FinancesBoard of Governors of the Federal Reserve System · accessed Oct 12, 2026